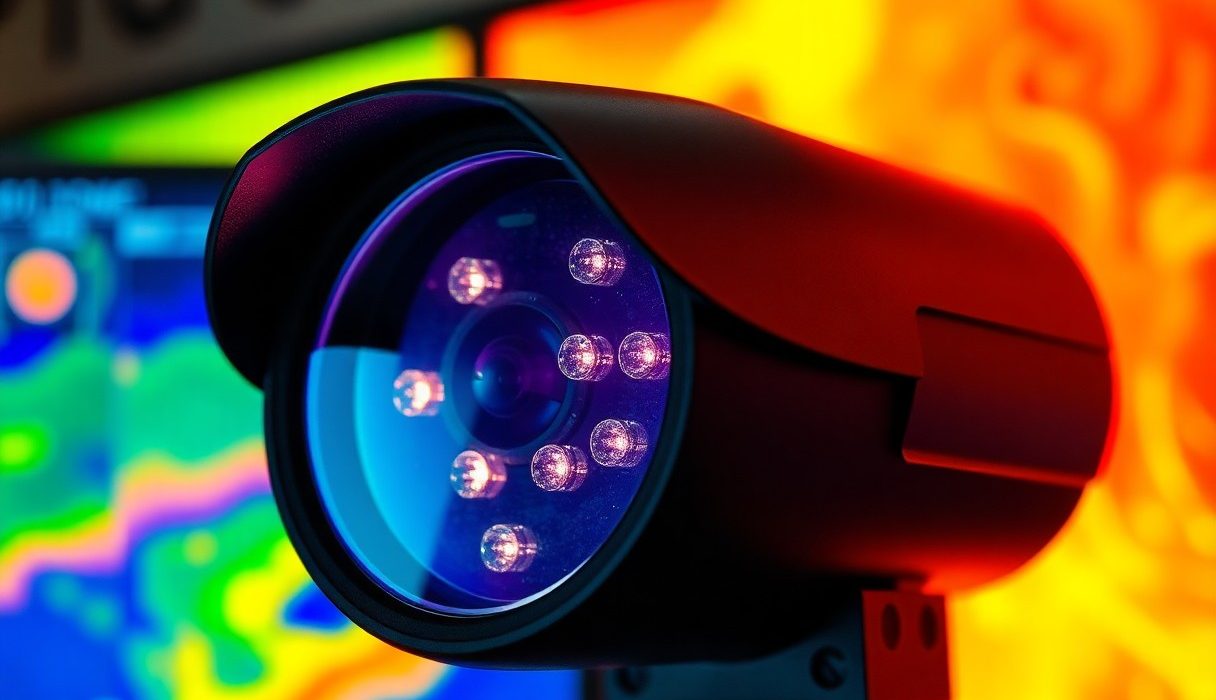
You integrate infrared sensors into your detection systems to gain superior situational awareness; they detect heat signatures through smoke, darkness, and obscurants, improving response times and reducing false alarms. By revealing overheating equipment and hidden humans, they identify dangerous failures and life-threatening conditions early, support automation and analytics, and extend operational capability in challenging environments while complementing visible-light sensors.
Types of Infrared Sensors
| Passive Infrared Sensors (PIR) | Detect emitted thermal radiation changes; typical range 5-12 m, wide FOV via Fresnel lenses; low power, common in occupancy and alarm systems. |
| Active Infrared Sensors | Emit IR and measure reflection or interruption; modes: through-beam, retroreflective, diffuse; range up to 100 m for through-beam, modulated to reject background light. |
| Thermal Imaging Cameras | Produce temperature maps; uncooled microbolometers (NETD ~50-100 mK) or cooled detectors (<0.05 °C NETD); resolutions commonly 320×240 to 640×480 pixels. |
| SWIR Sensors | Operate ~0.9-1.7 μm (InGaAs); useful through glass and for short-range laser detection; effective in low-light imaging and specific spectral contrast tasks. |
| LWIR Sensors | Operate ~8-14 μm; detect object temperature without illumination; widely used for night surveillance and condition monitoring in industrial plants. |
- infrared sensors
- Passive Infrared (PIR)
- Active Infrared
- Thermal Imaging
Passive Infrared Sensors
You use PIR modules to detect changes in emitted thermal energy rather than to image a scene, which makes them ideal for simple occupancy detection and intrusion alarms. In practical deployments you will fit a Fresnel lens array to segment the field of view into zones; each zone crossing by a warm body triggers differential elements – typical commercial units cover 5-12 m with a 90°-180° FOV. For example, building automation projects often report energy savings of 20-40% after retrofitting corridor and restroom lighting with PIR-based controllers because the sensors reliably switch loads based on real occupancy.
When you tune sensitivity and temporal filtering, note that pets, HVAC drafts, and rapid temperature gradients produce false alarms, so choose dual-element sensors and pet-immunity lenses or adjust logic thresholds. Mounting height affects detection pattern: ceiling mounts at 2.5-3.5 m maximize coverage for offices, while wall mounts at 1.8-2.2 m work better for corridors; your sensor placement and lens choice directly control detection granularity and alarm rates.
Active Infrared Sensors
You deploy active infrared systems where discrete beam detection or distance measurement is needed: through-beam pairs deliver the most reliable detection for perimeter barriers and conveyor presence sensing, with ranges up to 100 m and response times in the sub-millisecond to millisecond range. Alternative retroreflective and diffuse setups simplify installation but are more vulnerable to ambient IR and obscuration; industry guidance recommends modulated pulsed beams at kHz rates to reject sunlight and flicker, and optical bandpass filters matched to emitter wavelength to improve SNR.
In more complex systems you leverage pulsed time-of-flight or phase-shift measurements for ranging – automotive and robotics applications commonly use 905 nm or 1550 nm laser-based active sensors. For instance, 905 nm LiDAR assemblies can detect pedestrians at 50-200 m with centimeter-level relative accuracy at short ranges, while eye-safe 1550 nm enables higher pulse energy for longer-range detection without exceeding safety limits.
Signal processing also matters: you implement matched filters, background subtraction, and adaptive thresholds to mitigate fog, rain, and direct-sun interference; combining active IR with thermal or visible sensors in sensor fusion reduces false positives and extends detection capability under varying conditions. After you validate modulation schemes, ambient-rejection filters, and mechanical enclosure IP ratings under real-world weather and lighting, verify performance metrics such as detection probability, false-alarm rate, and maximum reliable range.
Tips for Choosing the Right Infrared Sensor
Match the sensor’s core specifications to the task: select a spectral band (LWIR 8-14 µm for passive thermal scenes, MWIR 3-5 µm for high-temperature targets), target range and required resolution (a 320×240 FPA may be adequate for person detection at 100 m; 640×512 or greater is preferred for identification beyond 300 m). Pay attention to NETD (noise equivalent temperature difference) – values under 50 mK indicate high thermal sensitivity for subtle temperature contrasts – and to frame rate (30 Hz is typical for surveillance; 60-120 Hz is necessary for fast-moving targets). Balance optics (f/1.0-f/2.0 lenses increase sensitivity) against form factor and cost when you size the system.
- Infrared sensor: choose type (bolometer vs. cooled photon) based on sensitivity and budget
- Thermal sensitivity (NETD): lower is better for low-contrast detection
- Resolution: 320×240 vs 640×512 vs 1280×1024 trade-offs
- Frame rate: 30 Hz standard, 60+ Hz for dynamic targets
- Wavelength: LWIR for passive, MWIR for hot sources
Factor in lifecycle costs: cooled detectors deliver superior sensitivity and longer detection ranges but add power, maintenance, and cost; uncooled microbolometers lower weight and complexity while still offering adequate performance for many security and industrial cases. Also verify interface compatibility (GigE Vision, USB3, analog outputs) and supplier field data – for instance, a transportation authority saw false-alarm rates drop by 40% after switching to a 640×512, NETD 30 mK camera with onboard temperature compensation.
Consider the Application
Determine whether you need detection, classification, or measurement: for simple presence detection you can use low-resolution microbolometers, but if you require facial recognition or precise temperature readings, plan for higher-resolution FPAs and calibrated radiometry (±0.5 °C accuracy). For industrial process monitoring, specify response time and spectral band – gas-plume detection may require midwave sensitivity and matched interference filters, whereas building inspections typically rely on longwave sensors with NETD <50 mK.
Think about mounting and optics: a fixed surveillance tower uses long-focus lenses with narrow fields of view (e.g., 2-6°) to extend detection to several hundred meters, while a drone application prioritizes compact weight and low power consumption. If you plan multisensor fusion, ensure the sensor provides time-synchronized triggers and geolocation output to integrate with LIDAR or visible-light cameras for reliable cross-cueing.
Assess Environmental Conditions
Account for operating temperature ranges, humidity, and particulate exposure: specify sensors rated for the site’s extremes (industrial ovens may exceed 200 °C, arctic installations can go below −40 °C), and choose housings with appropriate IP/IST ratings – IP66 or IP67 for outdoor systems is common. In corrosive or dusty environments, select coatings and sealed optics; corrosion or condensation can degrade performance rapidly.
Evaluate electromagnetic and mechanical stressors: sensors mounted on vehicles must tolerate vibration profiles (e.g., 5-20 g shocks, continuous vibration 5-200 Hz) and transient EMI from on-board electronics. For maritime deployments, salt spray and rapid temperature cycling increase risk of failure, so opt for marine-grade enclosures and test data showing successful operation over at least 1,000 hours in salt-fog chambers.
Use site-specific measurements where possible – field-test candidate units under representative lighting, thermal clutter, and weather (rain, fog, snow reduce LWIR and MWIR detection ranges by 20-80% depending on particle size and density) and quantify false-alarm rates and detection probability (PD) at target distances; select a sensor whose published PD/false-alarm performance matches your operational threshold. After evaluating these variables, choose a sensor with validated field performance and supplier support.
Step-by-Step Installation Guide
Installation Checklist
| Site Prep | Clear sightlines for 1-2 m radius, verify mounting heights, identify heat sources and reflective surfaces, and confirm power source location within 10 m. |
| Tools & Materials | Drill, anchor set (M8 for concrete, toggle bolts for drywall), torque driver, 18-22 AWG power cable, Cat5e/Cat6 for PoE, silicone sealant, surge protector. |
| Mounting Specs | PIR sensors: 2.5-3 m height; thermal cameras: 4-6 m or per lens spec; tilt 5-15° downward to reduce sky/ceiling false triggers. |
| Wiring & Power | PoE (802.3af/at) supported to 100 m over Cat5e; for 12 V DC runs keep under 20 m or upsize conductor to limit voltage drop; fuse per manufacturer. |
| Commissioning | Perform walk-test, log baseline false-alarm rates, adjust thresholds and zone masks, document final settings and GPS/plan locations. |
Preparing the Site
Survey the area and mark exact mounting points using a laser level and tape measure; you should place PIR units every 6-12 m along an unobstructed perimeter and thermal cameras where a 30-50 m detection radius is required depending on lens choice. Factor in environmental influences: keep sensors at least 1 m away from HVAC outlets, incandescent lighting or reflective glass panes to reduce false positives, and avoid mounting near high-current busways that can introduce EMI.
Assess structural conditions and select anchors to match the substrate-M8 wedge anchors for concrete, toggle anchors for hollow walls, or stainless-steel screws into metal brackets for trusses. Route power and data runs through conduit where possible, seal all penetrations with weatherproofing gel or silicone for outdoor installs, and confirm that the chosen sensor has an IP65 or higher rating for exterior exposure.
Mounting and Wiring the Sensor
Position the sensor so its primary field of view aligns with the protected zone; for example, mounting a PIR at 2.7 m with a 10° downward tilt often balances coverage and immunity to small animals. Use Cat5e/Cat6 for PoE deployments-which support runs to 100 m-and follow the 802.3af/at power budget when mapping devices on a switch. For low-voltage DC sensors, calculate voltage drop and specify conductor sizes: keep runs under 20 m for 12 V systems or increase gauge to maintain voltage within manufacturer tolerances; add a dedicated inline fuse (typical values 0.5-2 A) at the power feed.
Secure all cables with strain relief and maintain minimum bend radii for network and power conductors; incorporate a surge protector at the service entry for outdoor systems, and bond or ground shields per local code to minimize EMI. During wiring, ensure any exposed terminals are insulated and that you de-energize circuits before connecting to avoid shock and damage to the sensor electronics.
After physical mounting, perform a step-by-step commissioning routine: power the unit, update firmware, run the manufacturer’s alignment and sensitivity wizards, execute a walk-test across all zones, and log initial false-alarm counts for 48-72 hours; in one warehouse pilot, methodical angle adjustment and masking reduced nuisance alarms by ~35%, illustrating the value of iterative tuning.
Factors Influencing Sensor Performance
- Infrared
- NETD
- Field of View
- Thermal Drift
- Signal-to-Noise Ratio
Temperature Sensitivity
Sensor output shifts with ambient and detector temperature because responsivity and offset are temperature-dependent; for example, uncooled microbolometers typically have a NETD of 30-50 mK at 25°C but can degrade by 10-30% if the detector heats by 20-30°C without stabilization. Field data from industrial inspections shows measurement drift of 0.1-0.5°C per degree ambient change for low-cost modules, whereas sensors with internal thermal control maintain stability within ±0.05°C over the same range.
To manage this you should apply active or passive temperature control (for instance, TEC modules or sip-pan thermal isolation), schedule on-site recalibration intervals based on manufacturer thermal coefficients (typical intervals: 3-12 months depending on drift), and monitor NETD and gain in your telemetry; systems using TECs often regain optimal NETD in under 60 seconds after a temperature step change.
Temperature Sensitivity Metrics
| Metric | Impact / Recommendation |
| NETD | Indicates minimal detectable ΔT. Aim for <50 mK for precision tasks; choose cooled detectors (<20 mK) for long-range or small-target detection. |
| Responsivity Temperature Coefficient | Specifies percent change per °C; apply compensation in firmware or use thermal regulation when coefficient >0.1%/°C. |
| Operating Temp Range | Select sensors rated for -40 to +85°C for outdoor use; add enclosures or heaters outside that range. |
| Thermal Drift | Defines offset change over time; plan calibration frequency (3-12 months) and use reference targets for in-field recalibration. |
| Stabilization Time | Time to return to spec after temp change. TEC solutions: <60 s; passive insulation: minutes to hours. |
Angle of Detection
Signal amplitude and spatial resolution vary with incidence angle because effective projected area and optical throughput fall off; a sensor with a nominal 60° FOV can see a 15-30% signal reduction at 30° off-axis due to cosine loss and lens vignetting, and modulation transfer function (MTF) typically worsens beyond ±20° from boresight. You should consult angular response curves in datasheets: manufacturers often provide detection distance versus angle where detection range drops by 50% at extreme angles.
Mounting and overlap strategies directly affect false-alarm rates and blind spots; in security deployments using 45° FOV modules, industry practice is to provide 20-30% overlap between adjacent sensors and to avoid placing sensors at grazing angles near reflective surfaces, which can produce specular returns and a marked increase in false positives. Also consider mechanical tilt limits, optical window coatings, and use of aspheric lenses to flatten off-axis performance.
Perceiving how FOV, target aspect, and environment interact lets you optimize sensor placement and lens selection to maintain required detection probability across the whole monitored scene.
Pros and Cons of Infrared Sensors
Pros and Cons Overview
| Pros | Cons |
|---|---|
| Non-contact measurement enables remote temperature and presence detection without touching the target | Emissivity and calibration errors can produce significant temperature inaccuracies if not corrected |
| Operates in darkness, useful for night surveillance and perimeter security | Performance drops in adverse weather – heavy rain, fog, or steam reduce effective range |
| Fast response (millisecond-scale) suitable for real-time monitoring and high-speed detection | Susceptible to false alarms from solar reflections, hot backgrounds, or sudden environmental changes |
| Low-power PIR options for battery-operated IoT sensors (typical operating current in the mW range) | Limited range for basic PIR devices (commonly 6-12 m for consumer-grade sensors) |
| Thermal imaging maps temperature across scenes for diagnostics (electrical, mechanical, building envelope) | High cost for high performance – uncooled microbolometer cameras ~$1,500-$15,000; cooled detectors often >$50,000 |
| Detects hidden hotspots in electrical panels and bearings before failure | Requires skilled interpretation to distinguish nuisance signals from real faults |
| Compact and integrable into drones, robotics, and automotive systems | Lower spatial resolution than visible cameras (typical arrays: 80×60 to 640×480 pixels) |
| Useful in safety and rescue – can locate people through smoke in firefighting scenarios | Privacy and regulatory concerns arise for long-range human detection in public spaces |
Advantages
You can deploy infrared sensors to extend detection capability where visible-light systems fail: thermal cameras and PIR modules detect people and hotspots in total darkness and through light obscurants. For example, a typical uncooled microbolometer camera with a 320×240 array will reliably show human-sized heat signatures at hundreds of meters with the right optics, while PIR modules offer motion detection at around 6-12 m for low-cost perimeter systems. In industry, that means you spot bearing overheating or electrical arcing before catastrophic failure, enabling predictive maintenance and reducing downtime by a measurable margin.
Your system benefits from rapid response and low-latency outputs: many IR detectors respond in milliseconds, which supports real-time control loops, automated shutoffs, and high-speed inspection lines. Additionally, you can choose implementations across a wide price-performance spectrum – from sub-$20 PIR sensors for presence detection up to thermal cameras in the low thousands for advanced diagnostics – letting you balance budget against detection range, resolution, and sensitivity.
Disadvantages
You must account for physical and interpretive limitations that can undermine detection reliability. Emissivity differences, reflective surfaces, and atmospheric absorption introduce measurement errors; for instance, polished metal surfaces can cause temperature underestimates by several degrees if you don’t apply emissivity correction. Heavy fog, rain, or steam can reduce effective range substantially, and small or partially occluded heat sources may be missed entirely by low-resolution arrays.
Your operational costs and logistical needs can also grow quickly: high-resolution, cooled detectors that extend range and sensitivity typically cost tens of thousands of dollars, and integrating them requires calibration, regular maintenance, and operator training. False positives are another operational concern – bright sunlight on glass or hot exhausts can trigger alarms, so you’ll need filter logic, contextual sensors, or image fusion to keep nuisance alerts under control.
More specifically, emissivity-related errors and atmospheric effects are the most common technical causes of misdetection: if you don’t correct for emissivity or compensate for transmission loss, your temperature readings can be off by several degrees, potentially masking a developing failure or creating a false alarm. For robust deployments you should plan for periodic calibration, scene-specific emissivity tables, and multi-sensor fusion (visible + IR or LiDAR) to mitigate these shortcomings.
Best Practices for Maintenance
Set a maintenance cadence that matches the sensor’s operating environment: for high-use or outdoor installations you should inspect monthly, for moderate indoor use quarterly, and for low-activity, controlled environments every 6-12 months. Track firmware revisions, calibration records, and failure logs in a centralized system so you can correlate performance trends; if you see a steady sensor drift of more than 0.5°C or a >15% increase in response time, schedule immediate recalibration or replacement.
Assign clear pass/fail criteria and escalation paths so technicians know when a degraded unit becomes a safety or security risk. Use manufacturer-recommended spare parts and a rotation plan that keeps at least one hot spare per critical zone, which typically reduces downtime by more than 50% in continuous-operation facilities.
Regular Testing
Implement functional tests tailored to the application: perform weekly walk-tests for perimeter security, daily pre-shift checks for industrial process monitoring, and monthly performance validation for fire-detection networks. Use either a calibrated heat source or standardized test patterns; for temperature-sensitive systems employ a NIST-traceable blackbody or a field calibrator with at least ±0.5°C accuracy when verifying thermal response.
Leverage built-in self-test (BIT) features and remote health telemetry to catch failures between manual checks-configure automated alerts for anomalies such as sudden offset changes or communication loss. In safety-critical deployments, incorporate an annual third-party audit that verifies your test logs, calibration intervals, and corrective-action history.
Cleaning Procedures
Prioritize optical cleanliness because surface contamination directly lowers sensitivity and increases false positives. Start each cleaning cycle by using a filtered air blower to remove loose dust, then wipe lenses with a lint-free microfiber cloth dampened with 70% isopropyl alcohol; avoid ammonia- or acetone-based cleaners that can damage anti-reflective coatings. If the lens shows scratches or clouding after cleaning, mark the unit for replacement since damaged optics often lead to permanent performance loss.
Always follow safe handling: power down the sensor or engage the approved hot-swap procedure, wear nitrile gloves and ESD protection, and never spray solvents directly onto the optics-apply solvent to the cloth and make 3-5 gentle passes along the curvature. After cleaning, run an immediate functional test to confirm signal levels and response time returned to baseline, and log the operation with the technician’s initials and the solvent lot number.
For frequency guidance, clean weekly in heavy-dust environments (mining, construction), monthly in typical outdoor installations, and every 6-12 months in controlled indoor spaces; replace desiccant cartridges and purge filters at the same intervals or sooner if you detect moisture on internal surfaces. Consult the sensor’s materials compatibility sheet before using any solvent-using an unapproved cleaner can void the warranty and accelerate coating degradation.
Conclusion
Upon reflecting, you recognize that infrared sensors provide your detection systems with enhanced situational awareness by revealing thermal signatures invisible to visible-light cameras. They extend detection into total darkness, through smoke, and adverse weather, enabling consistent monitoring and faster anomaly identification so you can respond decisively.
By integrating infrared sensors with analytics and IoT, your systems reduce false alarms, enable predictive maintenance, and deliver scalable, energy-efficient monitoring across security, industrial, and emergency-response applications. As you adopt these sensors, you improve reliability and operational effectiveness while preserving privacy by focusing on heat profiles rather than personal details.